What is a Metric Source
A metric source is a key part of Statsig’s semantic layer (and integrations to other Semantic Layers). A metric source consists of a data source, which is either:- A SQL Query that will be read as a view
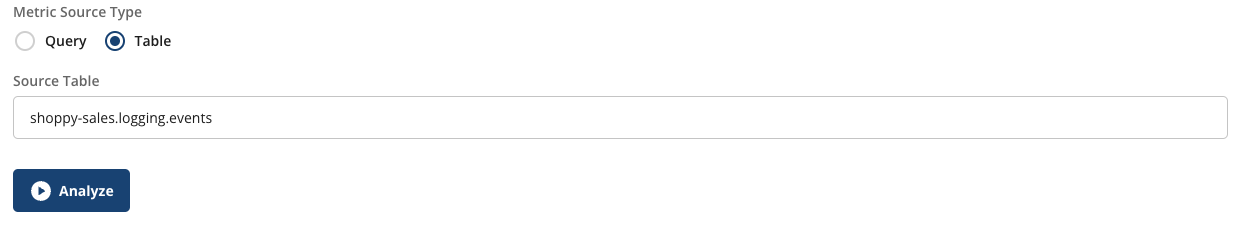
- A warehouse table
- [Required] identifier and timestamp columns
- [Optional] Aliases, partition information
- [Beta] Data quality checks and configuration
Data Sources
Getting Data
Statsig Metric Sources can use a query or a table as the source of their data. A query-based source will read a SQL query and use that as a source of truth. This, plus Statsig’s built-in query macros, provides an efficient and extremely flexible way to create experimental data sources.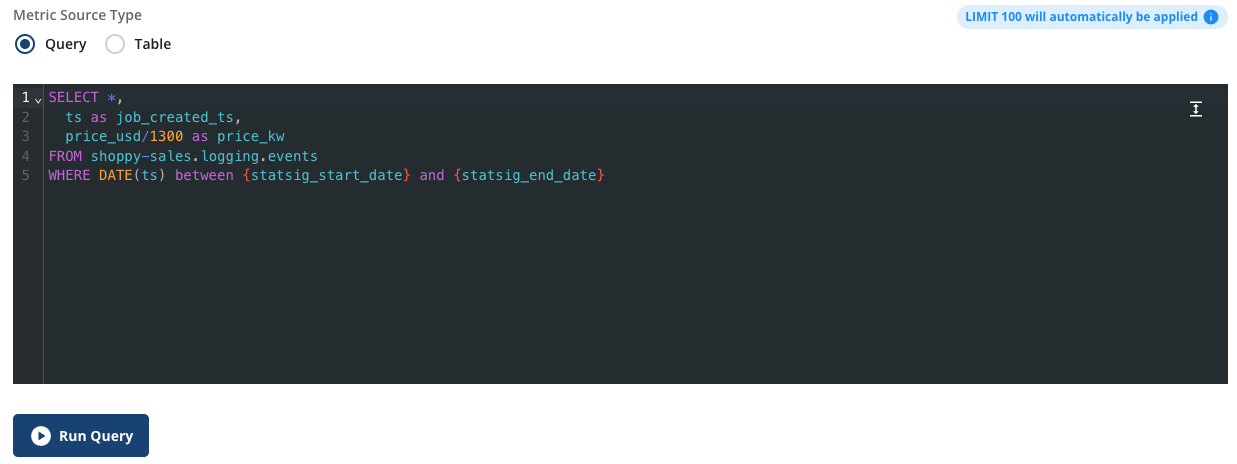
Configuring Data
For any source, you’ll be asked to select which field to use for the timestamp of the logs/metrics being provided, as well as 1 to N user identifiers that can be used to join to experiment data.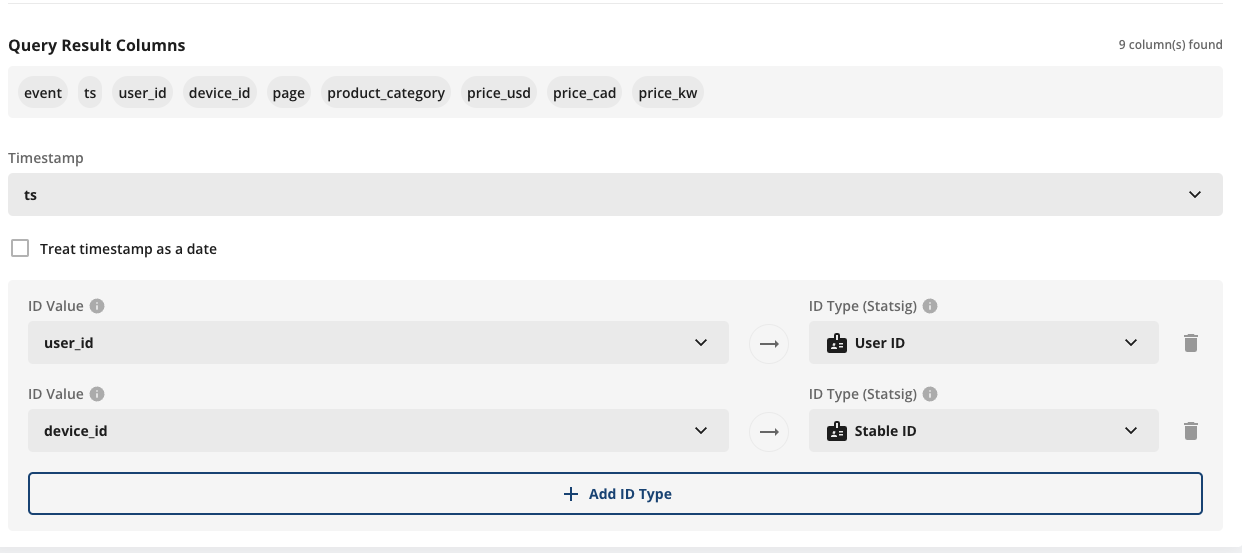
Types of Data
Statsig works natively with many different types and granularities of data. Common patterns are:1. Raw event logging (event level data), using the log timestamp as the timestamp, example:
event_time | user_id | event_name | platform | value |
|---|---|---|---|---|
| 2024-03-01 10:05:12 | u_123 | page_view | web | null |
| 2024-03-01 10:05:45 | u_123 | button_click | web | null |
| 2024-03-01 10:07:02 | u_456 | purchase | ios | 29.99 |
2.Fact tables (one row per entity per day), using the date of the row as the timestamp, example:
order_date | order_id | user_id | order_status | items_count | revenue |
|---|---|---|---|---|---|
| 2024-03-01 | o_10001 | u_123 | completed | 2 | 49.98 |
| 2024-03-01 | o_10002 | u_456 | completed | 1 | 19.99 |
| 2024-03-02 | o_10003 | u_123 | refunded | 1 | 19.99 |
3.Aggregated fact tables at unit day granularity, using the date of the row as the timestamp, example:
date | user_id | sessions | purchases | revenue |
|---|---|---|---|---|
| 2024-03-01 | u_123 | 3 | 1 | 29.99 |
| 2024-03-01 | u_456 | 1 | 0 | 0.00 |
| 2024-03-02 | u_123 | 2 | 0 | 0.00 |
Types of data that needs some transformation
There are times when you might have a table that does not fall into the schema mentioned above. For example, a wide user dimension table contains one row per user with pre-aggregated or derived behavioral attributes.user_id | signup_date | first_active_date | first_page_view_date | first_purchase_date | last_active_date | lifetime_revenue | is_power_user |
|---|---|---|---|---|---|---|---|
u_123 | 2023-11-12 | 2023-11-12 | 2023-11-12 | 2023-11-20 | 2024-03-02 | 249.85 | true |
u_456 | 2024-01-05 | 2024-01-06 | 2024-01-05 | 2024-02-10 | 2024-02-18 | 19.99 | false |
u_789 | 2024-02-10 | 2024-02-10 | 2024-02-10 | null | 2024-03-01 | 89.97 | false |
signup, first_active, and last_active). Statsig’s stats engine relies on a timestamp column to join metric data with exposure timestamps, ensuring that only metric events that occur after a user is exposed to an experiment are included in analysis.
For example, suppose you configure signup_date as the timestamp column for this metric source. If you then attempt to build a funnel metric across multiple events (for example, signup → first_active → first_purchase), Statsig will treat all funnel steps as occurring at the signup date. This happens because the metric source can only use a single configured timestamp column. As a result, the event-specific timestamps stored in other columns (such as first_active_date or first_purchase_date) are ignored, and the funnel no longer reflects the true timing of each event.
To address this, there are two recommended options:
- Use upstream tables as the metric source: Define metrics directly from event logs or fact tables where each row represents a single event and includes a clear timestamp.
- Collapse the table into a long format: Reshape the wide user table into a long table (for example, one row per user per event or per day) with a unified timestamp column that can be configured in Statsig.
user_id | event_type | event_timestamp |
|---|---|---|
u_123 | signup | 2023-11-12 09:15:00 |
u_123 | first_active | 2023-11-13 10:02:41 |
u_123 | last_active | 2024-03-02 18:45:10 |
u_456 | signup | 2024-01-05 14:22:09 |
u_456 | first_active | 2024-01-06 08:11:54 |
Managing Metric Sources
In the metric source tab, you can see your metric sources and the metrics/experiments they’re being used in. This varies; in some cases, it can make sense to have a broad metric source that’s reused with many metrics using different filters and aggregations. In others, a metric source might exist for one metric (such as a set of specific events for a funnel).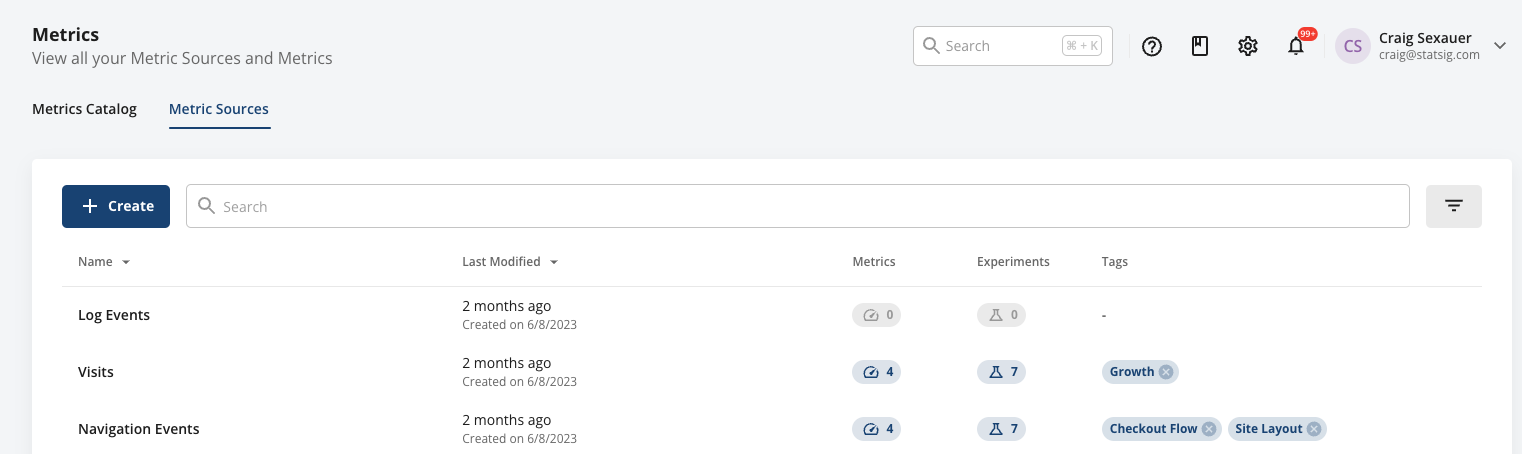
Programmatic Updates
You can create and modify metric sources via API and as part of your release flow for data systems. This is full-service and allows for the creation of read-only artifacts. Refer to the console API and Semantic Layer Sync sections.Note - Governance
If you are concerned about granting Statsig broad warehouse access, our recommended solution is to only give Statsig access to its own staging schema/dataset, and create views or materialize staging tables in that location for the data you want Statsig to see.Daily Vs. Realtime Sources
When specifying a timestamp, you can also specify if the metric source contains data at a daily or timestamp granularity by toggling the “Treat Timestamp as Date” setting.
2024-01-01T11:00:00 and an event occurs at 2024-01-01T11:01:00 on the same day, the event will be attributed to the experiment results because it happened after the exposure. Conversely, if the event occurs at 2024-01-01T10:59:00, just before the exposure, it will not be attributed to the experiment results since it happened prior to the exposure.
On the other hand, if the “Treat Timestamp as Date” setting is enabled, the system performs a date-based join. In this case, all events occurring on the same calendar day as the exposure, regardless of the time, will be included in the experiment results. This includes data from the first day of exposures, ensuring that day-1 metrics are not omitted from the analysis.
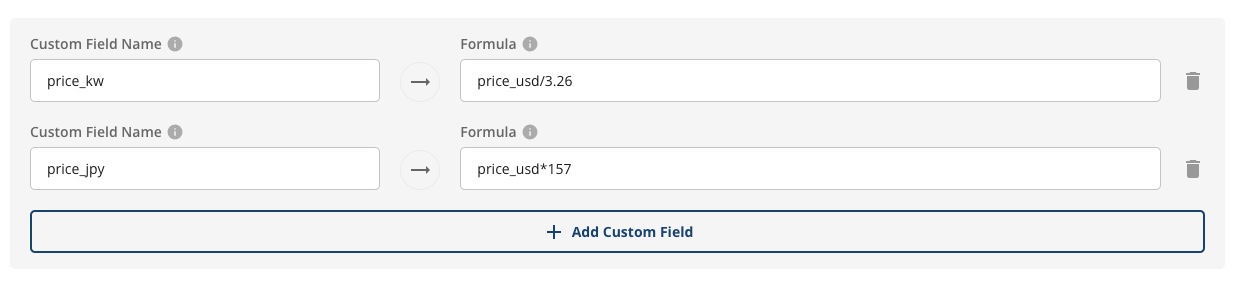
All Statsig needs to create metrics is a timestamp or date, and a unit (or user) identifier. Context fields let you pull multiple metrics from
the same base query, and select values to sum, mean, or group by.
| Column Type | Description | Format/Rules |
|---|---|---|
| timestamp | Required an identifier of when the metric data occurred | Castable to Timestamp/Date |
| unit identifier | Required At least one entity to which this metric belongs | Generally a user ID or similar |
| additional identifiers | Optional Entity identifiers for reuse across identifier types | |
| context columns | Optional Fields which will be aggregated, filtered, or grouped on |
| timestamp | user_id | company_id | event | time_to_load | page_route |
|---|---|---|---|---|---|
| 2023-10-10 00:01:01 | my_user_17503 | c_22235455 | page_load | 207.22 | / |
| 2023-10-10 00:02:15 | my_user_18821 | c_22235455 | page_load | 522.38 | /search |
| 2023-10-10 00:02:22 | my_user_18821 | c_22235455 | serp_click | null | /search |
| timestamp | user_id | company_id | country | page_loads | satisfaction_score | revenue_usd | net_revenue_usd |
|---|---|---|---|---|---|---|---|
| 2023-10-10 | my_user_17503 | c_22235455 | US | 13 | 9 | 130.21 | 112.33 |
| 2023-10-10 | my_user_18821 | c_22235455 | CA | 1 | 2 | 0 | 0 |
| 2023-10-10 | my_user_18828 | c_190887 | DE | 0 | null | 22.1 | 0 |
(Very) Slow Metric Sources
Statsig uses techniques like Statsig macros, push-down-filters (predicate filters) and using partition keys to make queries in your warehouse efficient. While Metric Sources can include joins or complex queries, they should be performant. If they are not - using any metrics based off this metric source will become expensive (or cause timeouts and failures). The same is true for assignment sources. Statsig will flag a metric source as slow if it takes more than 30 seconds to retrieve a sample of up to 100 records from the table. If the query is expensive, we recommend considering the following steps in sequence to optimize for your metric source:- Include filters based off partition column
- Use Statsig macros in SQL
- Pre-calculate some of the metrics to avoid joins or complex queries
- (Do this cautiously) Upgrade your computing resources if you are on a very small cluster.